Dashboard
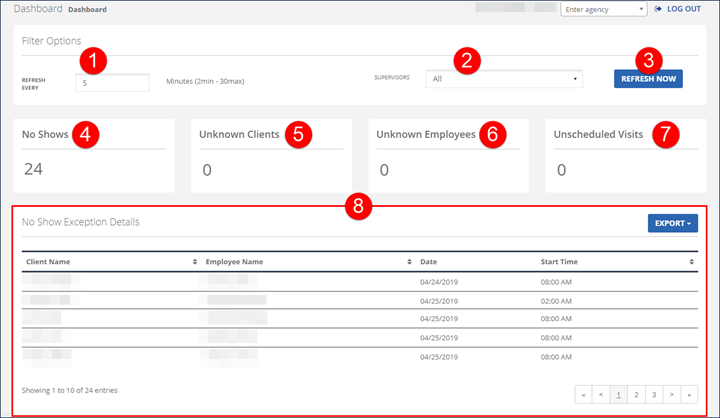
The Sandata EVV Dashboard displays visit information for the current day using a series of tiles which are updated in near-real time. On this screen, users can view the number of visits with certain exception types to quickly identify which exceptions need attention.
With these tiles, users can easily view and manage certain exception types without the need to search for and filter results on the Visit Maintenance screen. For example, the No Shows tile allows for the monitoring of no shows throughout the day, allowing action to be taken to ensure visits are occurring as scheduled.
Over time, more tiles may be added to this screen. Certain tiles (example: No Show, Unscheduled Visits) are tied to specific functionality and are only included on the Dashboard if that functionality is enabled.
Dashboard Screen
Dashboard Filter Options
| # | Filter |
Description |
|---|---|---|
| 1 | REFRESH EVERY |
Use this field to set the refresh rate. The refresh rate can be set to anywhere between 2 and 30 minutes by entering the desired value in the Refresh Every field. The default is 5 minutes. Information displayed on the dashboard is updated based on the last time the data was refreshed. |
| 2 | SUPERVISORS |
When configured, this field allows the user to view the dashboard information for clients associated with the selected supervisor. |
| 3 | REFRESH NOW |
Click this button to update the data displayed. |
Alert Tiles
The number displayed for each alert is the total number of visits flagged with the related exception for the current day. Each tile represents an exception type and the number within the tile indicates the number of visits flagged with that exception. Visits with more than one exception can be counted on multiple tiles. Clicking on the title brings the user to the Visit Maintenance screen and automatically sets the filters to display only visits flagged with the selected exception. Click the number within the tile to view a list of visits flagged with that exception, sorted by date and time, with the most recent visit appearing at the top of the list.
| # | Filter |
Description |
|---|---|---|
| 4 | No Shows |
This indicates there are visits in the system that were not started at the scheduled start time. |
| 5 | Unknown Clients |
This tile indicates the number of visits that do not have a client associated with them. |
| 6 | Unknown Employees |
This indicates the number of visits that do not have an employee associated with them. |
| 7 | Unscheduled Visits |
Indicates there are visits in the system that do not have a schedule associated with them. |
| 8 | Exception Details |
Displays a list of all visits flagged in the selected exception. |

Comments
0 comments
Please sign in to leave a comment.