Admissions by Primary Diagnosis
Description:
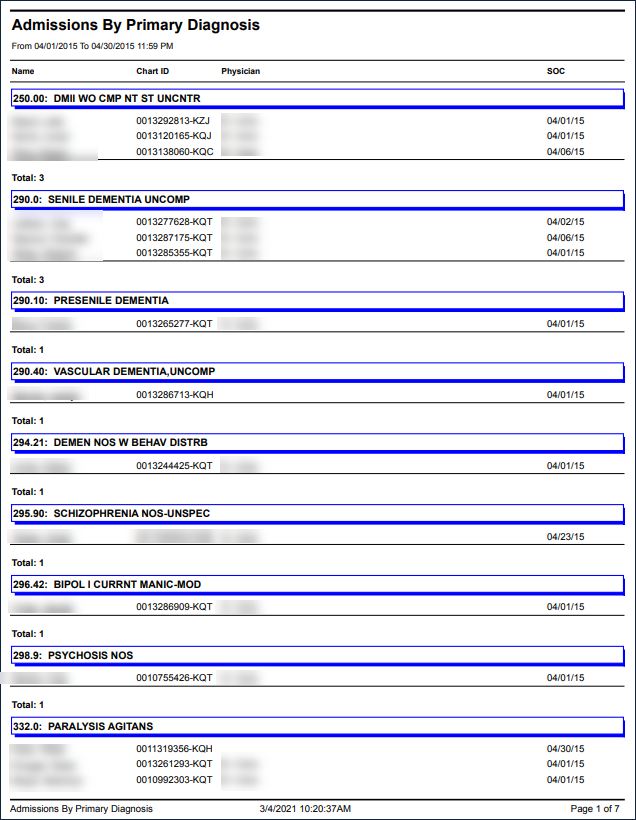
This report displays a list of all clients for the provider agency who were admitted within the selected date range. The report displays the clients sorted by their primary diagnosis on their EHR (Electronic Health Record) and includes their chart ID, physician and start of care date.
Use:
This is used to see Admissions grouped by Diagnosis Code, to see trends in primary diagnosis usage and assignment.
Limitations:
N/A
Filters
This report can be filtered by:
Field | Description |
|---|---|
Company | The selected company. |
Location | The selected location. |
Admit Type | The code for the client's admission. |
Team | The selected team. |
Date From | The first date of a selected range of dates. |
Date To | The last date of a selected range of dates. |
Sorting
This report can be sorted by:
Field | Description |
|---|---|
Client Name | The client's name. Blank if unknown. |
Start of Care Date | The client's Start of Care date. |
Report Output
Each column of the report displays:
Field | Description |
|---|---|
(Diagnosis) | A code and short description of the client's diagnosis. |
Name | The client's name. |
Chart ID | The client's Chart ID number. |
Physician | The client's primary physician. |
SOC (Start of Care) | The client's Start of Care date. |
Total (Diagnosis) | The total number of clients under each diagnosis. |
Total Clients | The total number of clients listed on the report. |

Comments
0 comments
Please sign in to leave a comment.